Table of Contents
Introduction
Project History and Research Methodology
Digital Talking Books
Guidelines for Describing STEM Images
Bar Charts
Line Graphs
Venn Diagrams
Scatter Plots
Tables
Pie Charts
Basic Flow Chart
Example H: Standard Diagrams and Illustrations
Example I: Complex Diagrams and Illustrations
Math Equations
Resources
Training Events
Acknowledgements
Bar Chart - Vertical
Guidelines:
- Bar charts should be converted into accessible tables.
- Briefly describe the chart and give a summary if one is immediately apparent.
- Provide the title and axis labels.
- It is not necessary to describe the visual attributes of the bars, e.g. dark blue, light blue, unless there is an explicit need such as an exam question referring to the colors.
Description:
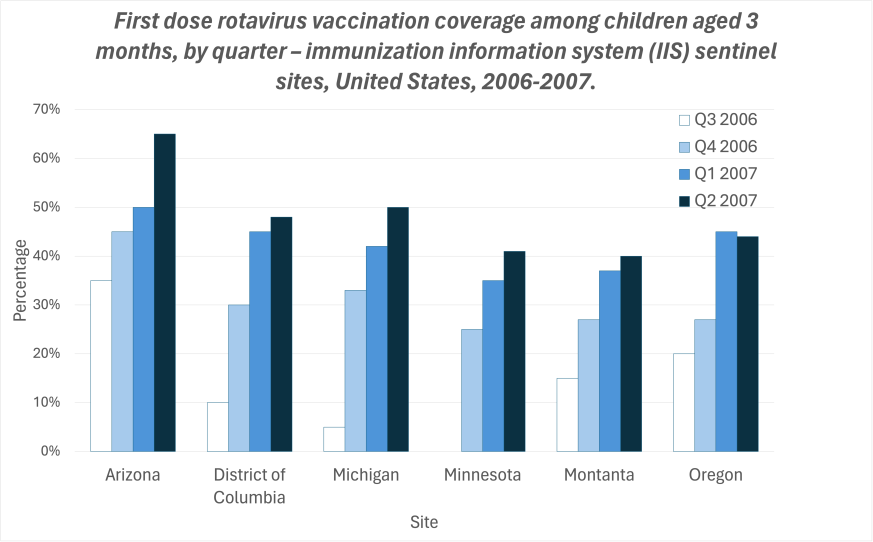
Figure 1 is a bar chart that measures percentage of vaccination coverage in five states over one year, from Q3 2006 to Q2 2007. In each state, the coverage increases over time.
The data are summarized in the following table. All data are approximate.
First dose rotavirus vaccination coverage among children aged 3 months, by quarter - immunization information system (IIS) sentinel sites, United States, 2006-2007.
| | Arizona | D.C. | Michigan | Minnesota | Montana | Oregon |
|---|---|---|---|---|---|---|
| Q3 2006 | 35% | 10% | 5% | 0% | 15% | 20% |
| Q4 2006 | 45% | 30% | 33% | 25% | 27% | 27% |
| Q1 2007 | 50% | 45% | 42% | 35% | 37% | 45% |
| Q2 2007 | 65% | 48% | 50% | 41% | 40% | 44% |
Bar Chart - Horizontal
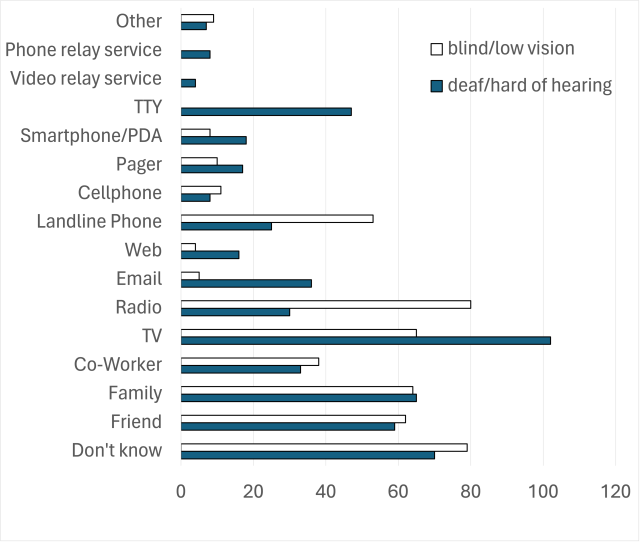
Title: How people who are deaf, hard-of-hearing, blind or have low vision are alerted to emergencies.
Guidelines:
- While most bar charts should be converted into accessible tables, this simple chart can bepresented as text in a list.
- Provide the title and labels.
- It is not necessary to describe the visual attributes of the bars unless there is an explicit need.
Description:
The figure is a bar chart that has been converted into the following table. All data are approximate.
How people who are deaf, hard-of-hearing, blind or have low vision are alerted to emergencies.
| Response | deaf/hard of hearing | blind/low vision |
|---|---|---|
| Don't Know | 70 | 79 |
| Friend | 59 | 62 |
| Family | 65 | 64 |
| Co-worker | 33 | 38 |
| TV | 102 | 65 |
| Radio | 30 | 80 |
| 36 | 5 | |
| Web | 16 | 4 |
| Landline Phone | 25 | 53 |
| Cellphone | 8 | 11 |
| Pager | 17 | 10 |
| Smartphone/PDA | 18 | 8 |
| TTY | 47 | 0 |
| Video relay service | 4 | 0 |
| Phone relay service | 8 | 0 |
| Other | 7 | 9 |
Alternate Approach for Simple Bar Chart
Funding for this project is provided by the National Science Foundation.
Contact NCAM
NCAM at GBH
One Guest Street
Boston, MA 02135